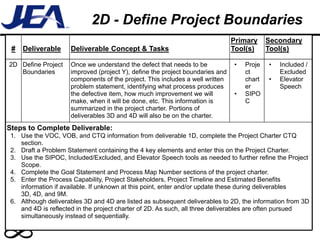
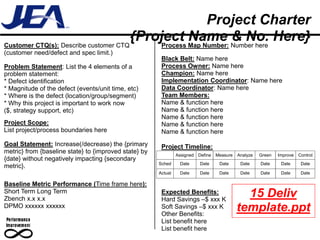
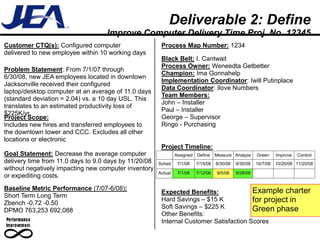
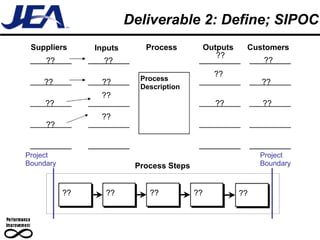
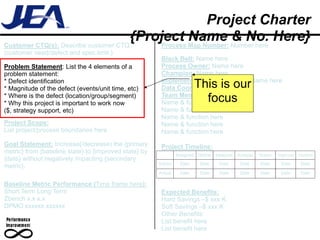
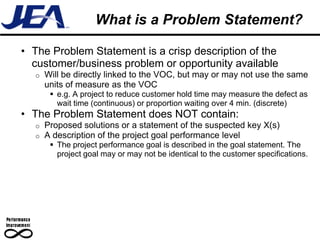
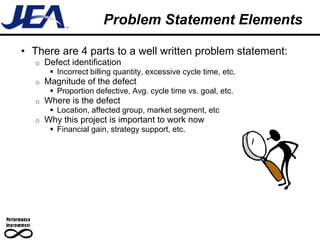
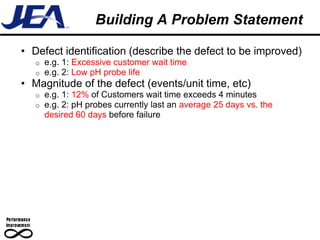
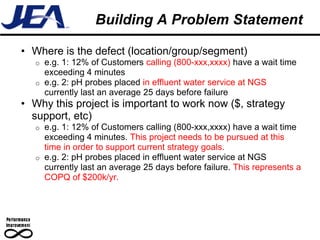
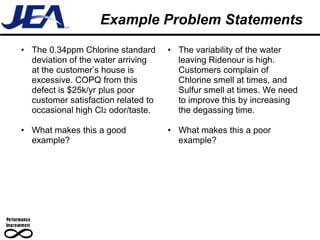
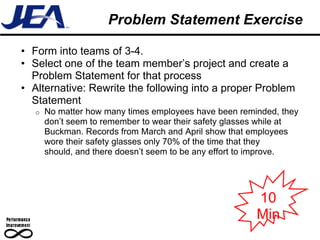
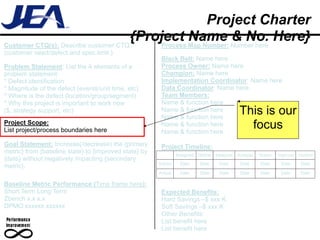
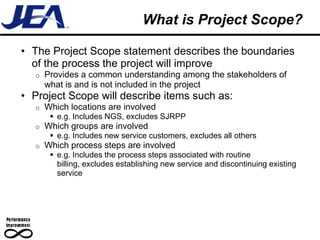
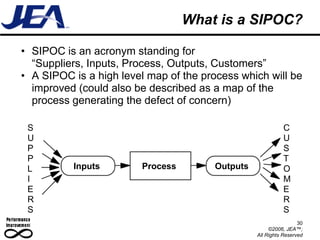
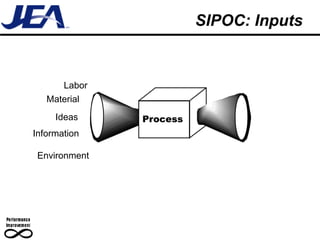
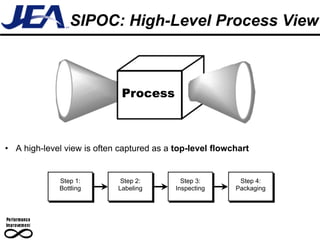
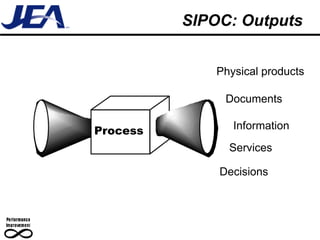
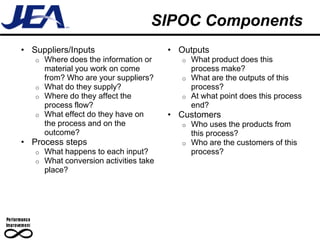
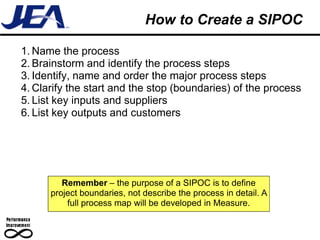
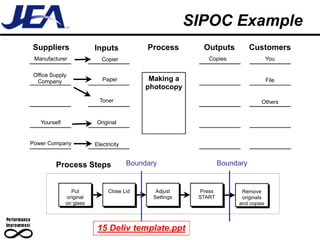
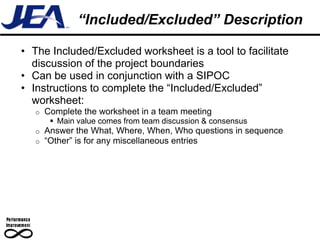
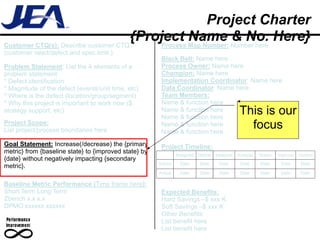
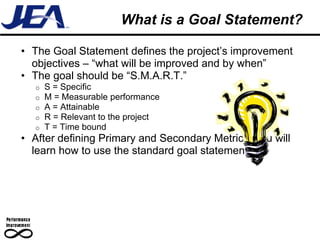
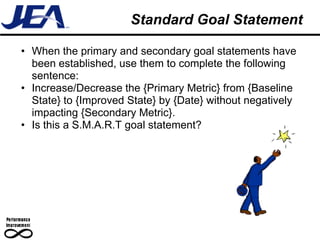
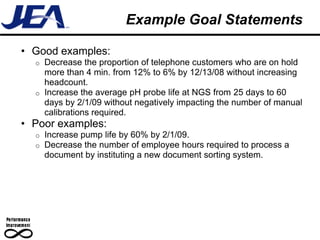
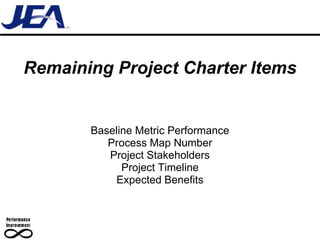
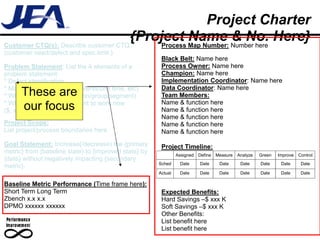
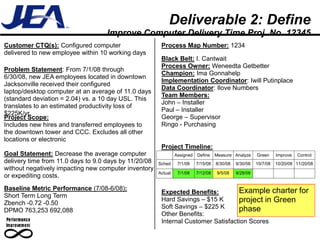
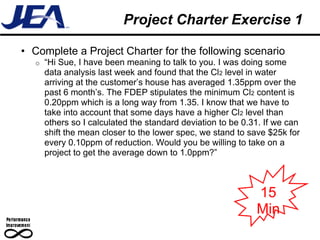
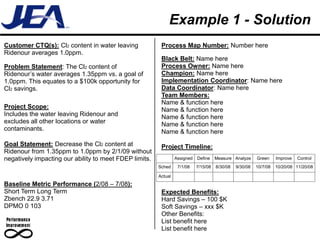
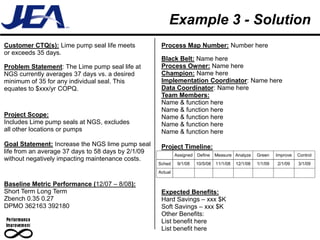
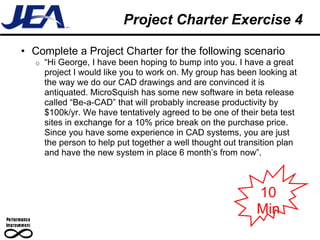
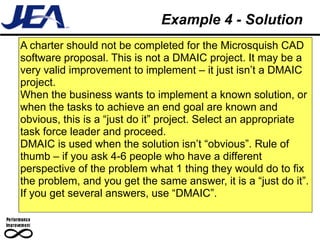
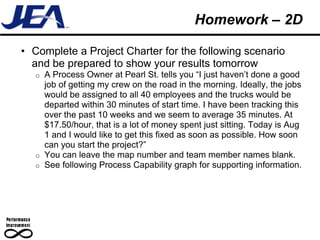
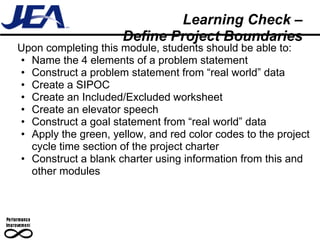
The document outlines the steps to complete Deliverable 2D - Define Project Boundaries, which includes drafting a problem statement, defining the project scope using tools like SIPOC and a project charter, and estimating benefits. It provides objectives for defining boundaries such as constructing a problem statement and goal statement. It also notes that aspects of other define deliverables may be reflected in the project charter.
The document defines key terms and deliverables for a Lean Six Sigma project. It explains that defining VOC (Voice of the Customer), VOB (Voice of Business), and CTQs (Critical to Quality requirements) is the first deliverable. This involves understanding the problem from the customer's perspective and how they define project success. Additional deliverables include defining the project scope, quantifying benefits, and developing a project management plan. Tools for each deliverable like affinity diagrams and project charters are also outlined.
The document defines the key deliverables and tasks for a Six Sigma project, including defining customer needs, project boundaries and value, and developing a project management plan. It discusses developing a communication plan, timeline, and gaining team consensus for the project plan. It also covers assessing project support through stakeholder analysis, recognizing resistance, and developing influence strategies.
This document outlines the steps in a Six Sigma DMAIC process improvement project. It includes defining the problem and critical metrics, measuring current performance, analyzing processes and measurements, improving the processes, and controlling future performance. Key steps are defining critical metrics, establishing baselines, determining root causes, piloting solutions, creating control systems, and finalizing documentation.
The document outlines the Define, Measure, Analyze, Improve, and Control (DMAIC) process for a Lean Six Sigma project. It provides details on the key deliverables for the Define phase, including:
1) Define VOC, VOB, and CTQs to understand the customer problem and specifications;
2) Define the project boundaries and scope through a problem statement, process mapping, and project charter;
3) Quantify the project value by calculating the cost of poor quality and benefits; and
4) Develop a project management plan identifying stakeholders, communication, milestones, and timelines.
This document appears to be a template for Lean event documentation. It includes sections for defining the problem and goals, documenting the existing process, identifying improvement opportunities, planning the event, documenting the improved process and transition plan, and establishing controls to ensure the benefits are sustained. The template provides guidance on the type of information, data, and documentation that should be captured at each stage of a Lean event to effectively define the problem, implement improvements, and institutionalize the new process.
The document discusses the process for identifying and selecting projects for black belts. It provides criteria for project selection such as the problem being related to key business issues and having organizational support. It also describes documenting potential projects with a project charter that includes details like the customer and process owner. Project ideas are evaluated based on their estimated financial impact and strategic importance to prioritize resources.
This document outlines the key phases, tools, and activities used in a Lean Six Sigma DMAIC project. It includes templates for project charters, value stream mapping, data collection plans, tollgate reviews, and team roles and responsibilities. The overview provides guidance on executing the define, measure, analyze, improve, and control phases of a Lean Six Sigma project from drafting the charter through transitioning the completed project.
This document defines the deliverables for a project to improve the computer delivery time process. Deliverable 2 involves defining the project boundaries, which includes writing a problem statement identifying the defect as computers being delivered in 11 days on average versus the 10 day goal, drafting a project charter with details of the scope, timeline and benefits, and setting a goal of decreasing the delivery time to 9 days by a target date. It provides guidance on tools to use for each deliverable such as a SIPOC, inclusion/exclusion list, and elevator speech.
This document appears to be a template for Lean event documentation. It includes sections for defining the focus and value of the event, documenting the current baseline process, developing a future state process map and transition plan, and establishing control tools to sustain benefits. The template provides guidance on the type of information, diagrams, and metrics to include in each section to fully document the Lean event from start to finish.
The document provides an overview of key project management terms and principles including the project management body of knowledge (PMBOK), the triple constraint of time, cost and scope, requirements definition, project planning, work breakdown structure, scheduling, earned value management, risk management, and some project management proverbs. It emphasizes the importance of scope management, configuration control, risk mitigation, and using tools like the work breakdown structure, scheduling, and earned value management to manage a project successfully.
The document discusses agile adoption and whether it leads to success or failure. It defines agile and compares it to the waterfall model, noting problems with waterfall like lack of flexibility. It also discusses reasons why agile projects may fail, such as not having the right tools, culture, or collaboration. The document provides a case study example and ways to measure agility of a team.
In enterprise-wide roles the PMO (Project Management Office or Program Management Office) will have responsibility for management and implementation of a tollgate or stage gate process for program and project approval. The purpose of this process is to ensure that investment decisions are made on a sound basis, that project portfolios have been rationalized and optimized, and that solid baseline foundations exist.
This paper we will take a closer look at the tollgate process and its oversight by the PMO.
The document discusses the Improve phase of the Lean Six Sigma methodology. It provides an overview of the key tools and activities used in the Improve phase, including identifying and prioritizing root causes, developing and selecting solutions, implementing pilots, and developing implementation plans. It also discusses tollgate reviews, which are checkpoints to review progress. The Improve phase aims to develop, test, and select solutions to address the root causes identified in the Analyze phase in order to meet the project goals.
Lean six sigma executive overview (case study) templatesSteven Bonacorsi
This case study describes a project to improve the average speed to answer calls at a retail business. The project team analyzed call data, identified root causes such as call type and time of day, and implemented cross-training and staffing changes. These improvements reduced customer downtime costs by $150,000 annually and increased the process sigma level. Key tools used in the project included data collection, analysis of call times, and control charts to monitor ongoing performance.
This document discusses business analysis techniques and provides definitions of business analysis. It lists and describes various techniques used in business analysis including stakeholder analysis, process modeling, requirements engineering, and solution development. The role of the business analyst is also discussed as investigating business situations, analyzing strategies, modeling processes, specifying information systems, and developing business cases. A basic toolkit of essential business analysis techniques is also presented.
Six Sigma Project Case Study Overview, from the General Electric "At the Customer, For the Customer" Six Sigma Program, led by Lean Six Sigma Master Black Belt and President of the International Standard for Lean Six Sigma (ISLSS) and Owner of the Lean Six Sigma Group
ITIL Practical Guide - Service TransitionAxios Systems
To view this complimentary webcast in full, visit: http://forms.axiossystems.com/LP=266
Integrating services with the business environment can be a daunting task. This video explains how you set success criteria and provide real, measurable business value. You will also learn the fundamentals of transition and release policy.
The document discusses key elements to include in a project charter such as the project description, objectives, scope, assumptions, constraints, roles and responsibilities, stakeholders, steps, deliverables, and risks. It emphasizes that the charter is an agreement between the project manager and sponsor that defines the project goals, deliverables, schedule, and resources. It should provide a clear and shared understanding of the project for all involved parties.
The document discusses identifying root cause relationships as part of a quality improvement process. It explains that before developing solutions to identified root causes, their relationships to environmental concerns like climate change, conservation, and sustainability must be examined. A relationship matrix tool is presented for mapping connections between root causes and relevant issues to ensure proposed countermeasures consider organizational environmental objectives. The deliverable aims to help explore these issues before solutions are selected to avoid suboptimal outcomes.
Speaking with facts tq & od project dimensions(1)Beth Perez
The document discusses project planning and management using total quality principles. It compares conventional consultant approaches to total quality approaches. Total quality approaches emphasize customer needs, client values, baseline variables, and long-term perspectives. They also focus on qualified clients, clear deliverables, empowering team members, and continually communicating and collaborating with clients to meet their needs and ensure project success.
This document contains 23 sets of video references related to Lean Six Sigma. Each set contains 10-15 video links on topics like the Define, Measure, Analyze, Improve and Control phases of Lean Six Sigma projects. The videos are from sources like Gemba Academy, SigmaXL, i-nexus and others. The document provides the video titles, descriptions and links to share or join related LinkedIn groups.
The document discusses deliverables mapping, which is a process for visualizing the key deliverables, milestones, and their relationships in a project. It involves identifying customer deliverables and requirements, internal deliverables, and regulatory requirements. A deliverables map shows the flow and linkage between these to establish schedule constraints. Benefits include improved communication, increased productivity by removing waste, and fostering teamwork and continuous improvement. Deliverables mapping is presented as an important tool for project planning and management.
8-step Problem Solving (Management)V2 (2)Steve Nails
This document summarizes an 8-step problem solving process used to address inspection delays at a 305th Maintenance Squadron. Step 1 identified 123 hours of delays during KC-10 inspections and 114 hours during C-17 inspections. Step 2 found issues with pre-dock meetings. Step 3 set a target to reduce delays by 20% by December 2013. Step 4 determined pre-dock planning, attendance and processes lacked standardization. Step 5 developed countermeasures like standardizing pre-dock meetings. Step 6 implemented countermeasures and Step 7 confirmed results, showing a 98.9% reduction in delays. Step 8 standardized successful processes to maintain improvements.
This document discusses quick changeover techniques to improve process efficiency. It begins by outlining an 8-step process improvement methodology. It then defines changeover times and differentiates between traditional and lean thinking regarding changeovers. The key steps to reducing changeover times are identified as separating internal and external changeover activities, converting internal activities to external where possible, and reducing all remaining activities through techniques like parallel operations and automation. The goal is to standardize and simplify changeovers to allow for smaller batch sizes and increased flexibility.
Coast guard social media chapter dtd 28 jan 2011Peter Stinson
This document provides guidance on the Coast Guard's use of social media. It establishes that Commandant (CG-092) is responsible for determining social media policy and requirements. Area and district public affairs offices oversee social media efforts in their regions and provide guidance to units. Unit commanders are ultimately responsible for social media content posted by their personnel. The document authorizes the use of social media tools like social networking pages, blogs, and microblogging for different levels of the Coast Guard and provides requirements for official Coast Guard social media sites.
El documento presenta un resumen biográfico de Josman Calzadilla. Detalla sus estudios formales e informales, los deportes que ha practicado como el béisbol y la natación, y sus actividades actuales como estudiante de ingeniería y trabajador en una empresa familiar de impresión. También expone sus metas a futuro de terminar sus estudios, aplicar sus conocimientos en la empresa familiar, formar una familia y realizar cursos de crecimiento personal para tener éxito como empresario y generar empleos.
This document appears to be a template for documenting a Lean event from start to finish. It includes sections for defining the problem and goals, analyzing the baseline process, planning and executing improvements during the event, and controlling the new process afterwards. The template provides guidance on including details such as metrics, stakeholders, process maps, plans for transitioning and training, and tools for ensuring the benefits are sustained long-term.
This document provides information on the 8-step CPI Roadmap process for improvement projects and the requirements to pass through the "Improve" tollgate. The 8 steps are: 1) Validate the problem 2) Identify performance gaps 3) Set improvement targets 4) Determine root cause 5) Develop countermeasures 6) See countermeasures through 7) Confirm results 8) Standardize successful processes. The tollgate requirements include delivering a solution prioritization, future state process map, implementation plan, pilot plan and results, process capability analysis, control charts, storyboard and barriers/risks identification.
Leave of Absence Reduction improvement process- L.O.A. ReductionJason Peart
The document describes issues with an inconsistent leave of absence (LOA) process at a company's education department. Specifically, it notes a lack of consistency creates unscheduled workflow that negatively impacts customer service and results in $2200 in lost revenue per student per month on average. A force field analysis identifies driving and resisting forces to promoting change. Process maps show the current inefficient "As Is" process and a proposed new efficient process to standardize the LOA granting procedure. Metrics to measure improvements in accuracy, labor hours, and increased revenue collection are provided. Finally, a customer requirement matrix outlines key quality characteristics and performance gaps for the processed LOA output.
QSM 381Hoshin planning tool review Team warehouse.Jason Peart
This document summarizes the results of an affinity diagram exercise conducted by a team to identify issues impacting the efficiency and quality of a warehouse operation. The team identified several key issues through the affinity exercise: employees feeling overwhelmed, inadequate training, disorganized inventory, uneven workloads, and errors impacting accuracy and timing. A SWOT analysis also identified strengths like knowledgeable employees but weaknesses like a new software with glitches and a lack of cross-training. A radar chart compares the current issues to a future desired state of improved processes, maintenance, training and quality.
This document appears to be a template for Lean event documentation. It includes sections for defining the problem and goals, documenting the current process, identifying areas for improvement, planning the new process, ensuring implementation of changes, and controlling the new process. The template provides guidance on the type of information, format, and level of detail needed for each section to fully capture the Lean event and ensure successful implementation and sustainability of improvements.
AFSO21 is the Air Force's standardized approach to continuously improve processes through lean principles in order to increase productivity, equipment availability, response time, safety, and energy efficiency. It utilizes lean methodology including specifying value, identifying the value stream, establishing flow without waste, pursuing perfection, and engaging Airmen. The goal is to eliminate non-value added activities and waste through relentless process improvement.
1. "Push marketing" refers to marketing where information is pushed to consumers with little initiation from the consumer. It involves using sales and promotion forces to put products and services into distribution channels and exert pressure.
2. "Pull marketing" refers to marketing where heavy expenses are used to incentivize consumers and buyers, with the aim of creating demand so consumers request products through various distribution channels themselves.
3. A combination "Push and Pull" strategy uses both approaches appropriately to incentivize intermediaries, buyers, consumers and customers to increase the company's market share.
This document provides an overview of simple linear regression modeling. It defines key regression terminology like independent and dependent variables. It explains how to visualize relationships between variables using scatter plots and how to calculate correlation coefficients. While correlation does not necessarily imply causation, regression can be used to generate prediction models. The document reviews best practices like planning data collection and model validation. It provides examples of applying regression in administrative, market research, and hospitality contexts.
The document provides an introduction to Six Sigma, defining it as a management philosophy that aims to reduce defects in processes. It discusses the Six Sigma definition and process, including the DMAIC and DMADV methodologies. It also outlines the roles of Green Belts, Black Belts, and Master Black Belts in executing Six Sigma projects and processes.
The document outlines the Define, Measure, Analyze, Improve, and Control (DMAIC) process for a Lean Six Sigma project. It provides details on the key deliverables for the Define phase, including:
1) Define VOC, VOB, and CTQs to understand the customer problem and specifications;
2) Define the project boundaries and scope through a problem statement, process mapping, and project charter;
3) Quantify the project value by calculating the costs of poor quality;
4) Develop a project management plan identifying stakeholders, communication plans, milestones, and timelines.
This document discusses the customer service profession and factors impacting its growth. It defines customer service and the service industry. The growth of the service sector is discussed, driven by societal changes like increased technology, globalization, and demographic shifts. Consumer behavior and expectations are also changing. A customer-focused organization meets customer needs through accessible information, policies, technology, and relationships. Addressing changes requires organizations to learn and adapt from the perspective of small businesses.
This document provides an overview of Project Management Deliverable 4D, which is to develop a project management plan. It lists the primary and secondary tools used, including developing a communication plan, creating a project schedule in Excel or MS Project, establishing team consensus, and facilitating effective meetings. The goals are to identify team members, interface with stakeholders, and develop a project plan with milestones and timelines to effectively manage the project.
This document discusses sustaining process improvements through project closeout and transitioning to process owners. It outlines the timeline for project closeout, including transitioning to the final process owner at a commissioning meeting and subsequent review meetings. Maintaining improvements requires executing process management, with elements like process maps, monitoring, and response plans. Process owners must institutionalize changes through cultural shifts and updated systems to drive permanent behavior changes.
The Toyota Production System (TPS) arose from Toyota's circumstances in the 1950s. Key elements include Just-in-Time production to eliminate waste, standardized work processes, visual management systems, continuous improvement through kaizen, and ensuring quality through jidoka. The overall goals of TPS are to provide high quality products, respect employees, reduce costs through waste elimination, and ensure flexibility. TPS focuses on eliminating waste and respecting people to reduce costs while increasing quality, flexibility, delivery speed and overall customer satisfaction.
The document defines key terms used in Six Sigma projects: VOC (Voice of the Customer), VOB (Voice of the Business), and CTQ (Critical to Quality). It provides steps to complete Deliverable 1D, which is to define VOC, VOB, and CTQs. This includes obtaining customer input to understand problems, defining how customers measure acceptability, and reviewing results with champions. The objectives of the module are also outlined.
This document outlines 5 key steps for effective project management in Six Sigma projects:
1. Developing a clear project charter that defines goals, scope, resources, and responsibilities.
2. Creating a detailed project plan using a Gantt chart to map out milestones and tasks.
3. Conducting weekly reviews of the project schedule to ensure it remains on track.
4. Implementing a formal tollgate review process to assess progress at key points.
5. Ensuring accountability from both the Champion and Black Belt for their respective roles and responsibilities.
This is a summary of the process to follow when creating and building websites and other such online media. It's a project process overview for thos in need of such a structure to help run their projects and for clients to get a better idea of how the whole process works. There ar of course other ways of running your projects but this is a good tried and tested stage by stage way of doing it. I've included responsibilities and example outputs as well as key things to do and watch out for each stage.
This document outlines the exam objectives for the CompTIA Project+ certification. The exam aims to certify competency in the core knowledge, roles, and skills needed to manage projects through all phases of the project life cycle. It is intended for candidates with at least 12 months of project management experience. The exam covers five domains: pre-project setup/initiating, project planning, project execution and delivery, change control and communication, and project closure. It contains around 100 multiple choice questions to be completed in 90 minutes.
The document discusses project scope definition and management. It states that project scope involves identifying and describing all work needed to produce the project's product in sufficient detail so the team understands their tasks and reasonably foreseeable work is included. It also discusses defining the scope of the project and product, developing a project scope statement, identifying deliverables, and using a "Green Car" example to illustrate scope concepts.
This document provides an overview of project management concepts including:
- The definition of a project, project life cycle, characteristics of projects, and tools and techniques used for project management.
- Key aspects of project management like project identification, scope, deliverables, team, and the role of the project manager.
- The project life cycle involves initiation, planning, execution, and closure to complete a project on time and on budget.
- Effective project managers demonstrate leadership, task delegation, and communication skills to guide a project team to success.
This document discusses project scope management. It defines project scope as the work involved in creating project deliverables and processes. Scope management ensures stakeholders agree on what will be delivered. Good scope management is important for project success and prevents common causes of failure like improper scope. Key scope management processes include scope verification, where the scope is formally accepted, and scope change control to manage any changes to the project scope. The document provides examples of scope planning tools like the scope statement and work breakdown structure used to define deliverables and divide work into manageable components.
Project Identification and Initiation Tool Kit Dave Angelow
The Project Initiation Document outlines the initiation of a project to standardize the product roadmapping process across business functions. It defines the current problem as inconsistent roadmapping that inhibits growth. The ideal state is described as a corporate-wide standard process supported by IT tools to deliver faster output. Key sections include defining the problem statement and impact, solution objective to standardize the process and select tools, scope, and high-level timeline.
Identification of all areas contributing to problems and determining scope of projects are challenges for many organizations. A method to improve the outcomes can help reduce risk - find out how!
The document discusses criteria for determining project success. It argues that using only time and budget constraints is too simplistic, as projects can exceed budgets but still be successful, or finish on time/budget but fail to achieve business goals. The document recommends setting a single target for project net present value at a defined point in time to account for schedule, cost, and revenue/profit forecasts. This allows managers to make decisions based on full business consequences and define success targets with contingency reserves for the project team, management team, and management.
This document is a project charter template for a project. It includes sections for the project description, objectives, scope, assumptions, approach, team structure, communication plan, risk mitigation plan, change control plan, and appendices for additional review processes. The project description should be 1-2 concise sentences explaining what the project will accomplish and for whom. The objectives, scope, and assumptions help define the goals, deliverables, and presumptions of the project. The approach outlines the planned methodology and timeline. The team structure identifies roles and responsibilities. The communication plan establishes regular check-ins. The risk plan evaluates potential issues.
The document discusses key concepts in project management including:
1. It defines the difference between project strategy and objectives, with strategy being the general approach and objectives being specific results to achieve.
2. It outlines the typical project life cycle including planning, implementation, testing, and commissioning phases.
3. It describes the Project Management Body of Knowledge (PMBOK) which defines 9 knowledge areas and 44 processes for effective project management.
4. It focuses on scope management and how to create a work breakdown structure (WBS) to decompose a project into deliverables and tasks. The WBS helps estimate timelines, costs, and monitor progress.
Calculate the variance for each activity and sum the critical path variances to calculate Z. Then use the standard normal distribution to find the probability of completing in less than 53 days.
Scope Scope StatementProject TitleProject SponserObjectiveMobile technology PlanVodafone IncSmart Phone Mobile Technology with safety devices, data entry operations,reliable and information sharing system.Executive Summary The business goals and objectives for this project will focus on implementing mobile technology that:
1. Create safety for officer, fire safety and citizens.
2. Help in coordinating in information sharing to both internal and external to the participant institutions.
3. Helps to create effectiveness amongst staff skill sets.
4. Facilitate electronic capturing of data at its source.
5. Eliminate irrelevant data entry jobs in the organization.
6. Ensure high data reliability.
7. Reduce unauthorise access and electronic crime.
8. Provide user friendly and fexible technology base for the future years.
Project Scope Statement The Project will introduce new mobile technology; including the following:
1. 3G/4G Networking
2.GPS device
3.Car to car messaging
4.Internet access
5.Mobile Gaming
6.One touch File sharing.
7.Various Other Interfaces like CAD,RMS,TlETS,AFR etcThe project does not include the following:
Devices in supervisor vehicles
Desktop hardware upgrade or replacement
Printers
MilestonesROM Budget The Overall funding requirement for this project will be $5000- $7000Milestone 1 -Secure agreement with vendors ( L3 & Tiburon)- 1 WeekMilestone 2- Order and Install equipment.- 2-4 WeeksMilestone 3- Install and test software.- 2-3 WeeksMilestone 4 - Conduct Hardware and software testing- 2 weeksMilestone 5 -Conduct training and implement ARS/AFR- 3-4 weeksInitial OrganizationThe engineering team will consist of Eight groups: Steering committee,Project sponsor, Project Manager,Design, Software, Hardware, Assembly, and TestingProduct DescriptionProject Roles and ResponsibilitiesRoleResponsibilitiesParticipant(s)Project Sponsor§ To approve the project or notMohammed§ Review the project thoroughly§ Suggest improvisations in the projectSteering Committee§ Approves the funding and resourcesNasser and team§ Allocate strategies, and suggest changes§ If any conflicts and issues crops up, help in resolving it§ Provide assistance to the Project Manager§ Review project deliverablesProject Manager§ Manages project according to the project planTo be identified by Steering committee§ Work in accordance with the Steering Committee§ Provides supervision to consultants and vendors§ Keeps a check on progress of project§ Guide the team members to achieve the goal and objectives§ Motivates and encourages team members§ Provide training to the team members§ Manages the project budgetProject Participants§ Visualize needs of customer and businessTo be identified by Steering Committee § Participates in market survey to understand marketing strategies§ Participate in seminars and meeting conducted by project manager.§ Communicate about the status and progress of the project and report to higher authority.§ Review the ma.
The document proposes establishing a project management organization to better manage projects at an agency. It analyzes the current state, identifying gaps such as a lack of clear goals and role confusion between project managers and business analysts. To address these gaps, the document recommends defining goals, roles and processes. Specifically, it suggests identifying options for retiring legacy systems, selecting a solution, and implementing it to provide clear direction. It also proposes treating project managers and business analysts as separate roles to improve requirements gathering and management of projects. Establishing distinct business and solution domains, and using business analysts and project managers to bridge between them, could help align projects with agency needs while considering constraints.
This document provides an overview of Six Sigma DMAIC methodology and tools. It defines DMAIC as Define, Measure, Analyze, Improve, and Control - a process for continuous improvement that is systematic, scientific, and fact-based. An index lists tools for each DMAIC phase, including project charters, process mapping, stakeholder analysis, measurement systems analysis, statistical analysis, solution selection matrices, control plans, and more. The purpose is to guide teams through the DMAIC workflow and problem solving process.
Business Analysts (BA) are tasked with reducing requirements timeline in a project life cycle as much as possible. However, BAs know all too well the issues in realistically identifying project activities and tasks. Both the Development and Quality Assurance (QA) staff’s project timelines are contingent upon the BAs delivery of requirements artifacts. Ultimately the success of the entire project hinges upon the correctness and timeliness of the BA deliverables.
The document provides an overview of project management frameworks and concepts. It discusses the growing demand for project management skills and the project management body of knowledge. It also summarizes key project phases like initiation, planning, execution, monitoring and control, and closing. Additionally, it outlines several project management tools and techniques such as work breakdown structures, Gantt and PERT charts, critical path method, and organizational project management maturity models. Finally, it briefly discusses Agile project management trends and PMI certifications.
VoIP Implementation WBSTask NameDurationStart DateEnd DatePredeces.docxjessiehampson
VoIP Implementation WBSTask NameDurationStart DateEnd DatePredecessors% CompleteStatusAssigned ToCommentsStartFinishCritical1. Intiation14d10/02/1910/15/1999%CompleteJevin 1.1 Recommendation & evaluation3d10/02/1910/04/19100%CompletedJenny 1.2 Project chart Deveelopment2d10/05/1910/06/19100%CompletedJenny 1.3 Outline of deliverable2d10/07/1910/08/19100%CompletedMark 1.4 Stakeholders analysis3d10/09/1910/11/194100%CompletedJoe 1.5 Charter signed by Authority4d10/12/1910/15/1995%In ProgressJoe2. Planning22d10/16/1911/07/19 2.1 Make a scope management2d10/16/1910/17/190%Not StartedJudy 2.2 Design the project team4d10/18/1910/21/090%Not StartedMolly 2.3 Intial meeting to boost the project3d10/22/1910/24/190%Not StartedMolly 2.4 Development of project plan2d10/25/1910/26/19130%Not StartedJudy 2.4.1 Create the schedules2d10/27/1910/28/190%Not StartedAlex 2.4.2 Analysis the critical path3d10/29/1911/01/190%Not StartedAlex 2.5 Submission of Project plan4d11/02/1911/05/190%Not StartedTim 2.6 Approval for project Plan2d11/06/1911/07/19120%Not StartedTiana3. Designing20d11/08/1911/27/19 3.1 Meeting to boost the team2d11/08/1911/09/190%Not StartedMandy 3.2 Verify the user requirements3d11/10/1911/12/190%Not StartedMandy 3.3 Designing of system4d11/13/0911/16/190%Not StartedKathy 3.4 procurement of software and hardware3d11/17/1911/19/190%Not StartedKathy 3.5 Installation of development system2d11/20/1911/21/190%Not StartedTim 3.6 Initiate testing3d11/22/1911/24/190%Not StartedHarry 3.7 Installation of live system2d11/25/1911/26/19200%Not StartedHarry 3.8 Training of users1d11/27/1911/27/190%Not StartedTiana4. Control20d11/28/1912/18/19 4.1 Management of Project4d11/28/1912/01/190%Not StartedMolly 4.2 Meetings to track the status of the meeting4d12/02/1912/05/190%Not StartedMolly 4.3 Risk management8d12/06/1912/13/190%Not StartedManoj 4.4 Updation of project management plan5d12/14/1912/18/190%Not StartedMandy5. Closing11d12/19/1912/29/19 5.1 Audit procurement4d12/19/1912/22/190%Not StartedAlisha 5.2 Updating and revision of documents2d12/23/1912/24/19300%Not StartedPrem 5.3 Update records and files2d12/25/1912/26/190%Not StartedHari 5.4 Receive the acceptance formally1d12/27/1912/27/190%Not StartedJames 5.5. Archieve Documents and files2d12/28/1912/29/190%Not StartedJames
Comments
Running Head: PROJECT PLAN-BUSINESS REQUIRMENT DOCUMENT 1
PROJECT PLAN-BUSINESS REQUIRMENT DOCUMENT 21
Project Plan-Business Requirement Document
CIS 599 Graduate Info Systems Capstone
Abstract
After finishing project plan inception with introduction Docume ...
The document discusses various topics related to project management including:
- An upcoming open book test on project management concepts on September 8th.
- The project lifecycle phases of initiation, planning, execution, monitoring, and closing.
- Key characteristics of projects including defined timeframes, stakeholders, goals, and resources.
- Important responsibilities of a project manager like creating a plan, monitoring performance, resolving issues.
- Knowledge areas of project management including time, cost, scope, quality, communication management.
The document discusses computer simulation as a tool for process improvement. It defines computer simulation as using a computer model to simulate a real system. The basic steps for computer simulation are: 1) define the problem, 2) map the process, 3) define inputs, 4) build the model, 5) validate the model, 6) perform simulations, 7) interpret results, and 8) recommend and document solutions. Reasons for using simulation include testing changes without risk or time constraints, understanding bottlenecks, and validating expected improvements. Simulation should not be used without proper training or understanding, or when simpler methods can achieve the goal.
This document provides an agenda and overview for a JEA Process Improvement Black Belt training on defining projects using the Six Sigma DMAIC methodology. It outlines the schedule and expectations for the define training week, including introducing the 15 deliverable format, methodology and tools for the define phase. It also covers emergency evacuation procedures and codes of conduct for the training.
This document provides guidance on using statistical tests to determine which process inputs (X's) are critical and influence outcomes (Y's). It outlines common statistical tests for continuous and discrete data, including tests for normality, one-sample t-tests to compare a mean to a target, and one-sample sign tests to compare a median when data is not normal. Examples are provided to illustrate how to use Minitab to conduct these tests and interpret the results.
The document provides an overview of the Power Steering project tracking tool used by the National Guard for continuous process improvement projects. It describes how to access and navigate Power Steering, the roles and responsibilities of Black Belts in using it to track project progress, and how to invite new users. The learning objectives are to understand how to use Power Steering to navigate, track projects, and share best practices.
The document discusses the process for identifying and selecting projects for black belts. It provides criteria for project selection such as the problem being related to key business issues and having organizational support. It also describes documenting potential projects with a project charter that includes details like the customer and process owner. Project ideas are evaluated based on their estimated financial impact and strategic importance to prioritize resources.
The document discusses identifying root cause relationships as part of a quality improvement process. It explains that before developing solutions to identified root causes, their relationships to environmental concerns like climate change, conservation, and protecting resources must be examined. A relationship matrix tool is presented for mapping which environmental issues need consideration for each root cause when developing countermeasures. The objective is to ensure improvements also advance the organization's environmental performance.
The document provides guidance for project tollgates, focusing presentations on satisfying 15 deliverables in each project phase and showing the logical thought process. Tollgate presentations should also list tasks and dates for the next phase, as well as barriers and assistance needed to complete the project on schedule. Projects are now performed using a standardized 15 deliverable format to guide tollgate reviews.
This document provides an overview of multiple regression analysis techniques. It begins with an introduction to multiple regression, explaining how it allows modeling of a dependent variable (Y) based on multiple independent variables (X1, X2, X3, etc). The document then outlines the basic steps for developing a multiple regression model, including visualizing relationships in the data, assessing correlation, generating a prediction equation, and validating the model. An example involving silver consumption in a production plant is presented to demonstrate these steps. The goal is to help readers understand how to identify correlation between variables, create mathematical models with multiple inputs, and examine a regression model.
This document defines the key deliverables and tasks for quantifying the value of a project. Deliverable 3D involves quantifying the project value by determining the benefits to customers and the organization. This includes calculating the cost of poor quality using baseline data and estimating savings. Project benefits are documented in the project benefit document and summarized in the project charter and final presentation.
The document provides instructions for a team to design and launch a balsa wood airplane to hit a target representing a varmint from 12-20 feet away. The team must use the Six Sigma DMAIC process to develop the airplane and launching system, and document their work in a presentation. They will be scored on accuracy in hitting the target from different distances and involvement of all team members. Payments will be made depending on whether the plane hits the target in flight or after landing.
This document provides information about measuring process improvement for the National Guard Black Belt Training Module 15. It outlines an 8-step CPI roadmap for measurement, including defining the problem, identifying performance gaps, setting improvement targets, determining root causes, developing countermeasures, seeing results through countermeasures, confirming results, and standardizing successful processes. It also lists tools that can be used during the measurement process, such as process mapping, data collection plans, control charts, and process capability analysis. Finally, it outlines the mandatory and recommended deliverables required to pass the measure tollgate, including current state process maps, metrics, operational definitions, baseline statistics, estimated benefits, and barriers/risks.
This document provides a flowchart to guide users in selecting the appropriate hypothesis test based on the type of data (continuous or discrete variables), number of variables, assumptions of the data, and other factors. It outlines hypothesis test categories and provides decision trees to navigate through options for continuous and discrete dependent and independent variables, from parametric to non-parametric tests. It also includes sections on control charts and considerations for chart selection based on data type, subgroup size, and sampling versus census data.
This document provides an overview of hypothesis testing basics and confidence intervals. It discusses key concepts such as population parameters versus sample statistics, the central limit theorem, and variability of means. It also covers confidence intervals when the population standard deviation is known and unknown. Examples are provided to demonstrate how to calculate confidence intervals for the mean. The goal is to introduce statistical tests and understand how sample sizes influence results.
Exploiting Artificial Intelligence for Empowering Researchers and Faculty, In...Dr. Vinod Kumar Kanvaria
Exploiting Artificial Intelligence for Empowering Researchers and Faculty,
International FDP on Fundamentals of Research in Social Sciences
at Integral University, Lucknow, 06.06.2024
By Dr. Vinod Kumar Kanvaria
A review of the growth of the Israel Genealogy Research Association Database Collection for the last 12 months. Our collection is now passed the 3 million mark and still growing. See which archives have contributed the most. See the different types of records we have, and which years have had records added. You can also see what we have for the future.
Macroeconomics- Movie Location
This will be used as part of your Personal Professional Portfolio once graded.
Objective:
Prepare a presentation or a paper using research, basic comparative analysis, data organization and application of economic information. You will make an informed assessment of an economic climate outside of the United States to accomplish an entertainment industry objective.
Assessment and Planning in Educational technology.pptxKavitha Krishnan
In an education system, it is understood that assessment is only for the students, but on the other hand, the Assessment of teachers is also an important aspect of the education system that ensures teachers are providing high-quality instruction to students. The assessment process can be used to provide feedback and support for professional development, to inform decisions about teacher retention or promotion, or to evaluate teacher effectiveness for accountability purposes.
Physiology and chemistry of skin and pigmentation, hairs, scalp, lips and nail, Cleansing cream, Lotions, Face powders, Face packs, Lipsticks, Bath products, soaps and baby product,
Preparation and standardization of the following : Tonic, Bleaches, Dentifrices and Mouth washes & Tooth Pastes, Cosmetics for Nails.
How to Fix the Import Error in the Odoo 17Celine George
An import error occurs when a program fails to import a module or library, disrupting its execution. In languages like Python, this issue arises when the specified module cannot be found or accessed, hindering the program's functionality. Resolving import errors is crucial for maintaining smooth software operation and uninterrupted development processes.
ISO/IEC 27001, ISO/IEC 42001, and GDPR: Best Practices for Implementation and...PECB
Denis is a dynamic and results-driven Chief Information Officer (CIO) with a distinguished career spanning information systems analysis and technical project management. With a proven track record of spearheading the design and delivery of cutting-edge Information Management solutions, he has consistently elevated business operations, streamlined reporting functions, and maximized process efficiency.
Certified as an ISO/IEC 27001: Information Security Management Systems (ISMS) Lead Implementer, Data Protection Officer, and Cyber Risks Analyst, Denis brings a heightened focus on data security, privacy, and cyber resilience to every endeavor.
His expertise extends across a diverse spectrum of reporting, database, and web development applications, underpinned by an exceptional grasp of data storage and virtualization technologies. His proficiency in application testing, database administration, and data cleansing ensures seamless execution of complex projects.
What sets Denis apart is his comprehensive understanding of Business and Systems Analysis technologies, honed through involvement in all phases of the Software Development Lifecycle (SDLC). From meticulous requirements gathering to precise analysis, innovative design, rigorous development, thorough testing, and successful implementation, he has consistently delivered exceptional results.
Throughout his career, he has taken on multifaceted roles, from leading technical project management teams to owning solutions that drive operational excellence. His conscientious and proactive approach is unwavering, whether he is working independently or collaboratively within a team. His ability to connect with colleagues on a personal level underscores his commitment to fostering a harmonious and productive workplace environment.
Date: May 29, 2024
Tags: Information Security, ISO/IEC 27001, ISO/IEC 42001, Artificial Intelligence, GDPR
-------------------------------------------------------------------------------
Find out more about ISO training and certification services
Training: ISO/IEC 27001 Information Security Management System - EN | PECB
ISO/IEC 42001 Artificial Intelligence Management System - EN | PECB
General Data Protection Regulation (GDPR) - Training Courses - EN | PECB
Webinars: https://pecb.com/webinars
Article: https://pecb.com/article
-------------------------------------------------------------------------------
For more information about PECB:
Website: https://pecb.com/
LinkedIn: https://www.linkedin.com/company/pecb/
Facebook: https://www.facebook.com/PECBInternational/
Slideshare: http://www.slideshare.net/PECBCERTIFICATION
This presentation was provided by Steph Pollock of The American Psychological Association’s Journals Program, and Damita Snow, of The American Society of Civil Engineers (ASCE), for the initial session of NISO's 2024 Training Series "DEIA in the Scholarly Landscape." Session One: 'Setting Expectations: a DEIA Primer,' was held June 6, 2024.
A Strategic Approach: GenAI in EducationPeter Windle
Artificial Intelligence (AI) technologies such as Generative AI, Image Generators and Large Language Models have had a dramatic impact on teaching, learning and assessment over the past 18 months. The most immediate threat AI posed was to Academic Integrity with Higher Education Institutes (HEIs) focusing their efforts on combating the use of GenAI in assessment. Guidelines were developed for staff and students, policies put in place too. Innovative educators have forged paths in the use of Generative AI for teaching, learning and assessments leading to pockets of transformation springing up across HEIs, often with little or no top-down guidance, support or direction.
This Gasta posits a strategic approach to integrating AI into HEIs to prepare staff, students and the curriculum for an evolving world and workplace. We will highlight the advantages of working with these technologies beyond the realm of teaching, learning and assessment by considering prompt engineering skills, industry impact, curriculum changes, and the need for staff upskilling. In contrast, not engaging strategically with Generative AI poses risks, including falling behind peers, missed opportunities and failing to ensure our graduates remain employable. The rapid evolution of AI technologies necessitates a proactive and strategic approach if we are to remain relevant.
Executive Directors Chat Leveraging AI for Diversity, Equity, and InclusionTechSoup
Let’s explore the intersection of technology and equity in the final session of our DEI series. Discover how AI tools, like ChatGPT, can be used to support and enhance your nonprofit's DEI initiatives. Participants will gain insights into practical AI applications and get tips for leveraging technology to advance their DEI goals.
How to Manage Your Lost Opportunities in Odoo 17 CRMCeline George
Odoo 17 CRM allows us to track why we lose sales opportunities with "Lost Reasons." This helps analyze our sales process and identify areas for improvement. Here's how to configure lost reasons in Odoo 17 CRM
2. Define Module Roadmap
Define Measure
1D – Define VOC, VOB, and CTQ’s 5M – Document Process
2D – Define Project Boundaries 6M – Prioritize List of X’s
3D – Quantify Project Value 7M – Create Data Collection Plan
4D – Develop Project Mgmt. Plan 8M – Validate Measurement System
9M – Establish Baseline Process Cap.
Control Analyze
14C – Create Control System
15C – Finalize Project Documentation 10A – Determine Critical X’s
Improve Green
12I – Prioritized List of Solutions 11G – Identify Root Cause Relationships
13I – Pilot Best Solution
3. Deliverables – Define
Primary Secondary V1.2
# Deliverable Deliverable Concept & Tasks Tool(s) Tool(s)
1D Define A project is started because a customer (internal or external) • VOC • Affinity Diagram
VOC, VOB and needs some problem to be solved. Deliverable 1D obtains Worksheet • Stratification
CTQs customer input to understand the problem(s) that the customer is tools (Pareto
experiencing so that a project can be started. In addition to and other basic
defining the problem, we also need to understand how the graphs)
customer defines product acceptability (specifications).
2D Define Project Once we understand the defect that needs to be improved (project • Project • Included /
Boundaries Y), define the project boundaries and components of the project. charter Excluded
This includes a well written problem statement, identifying what • SIPOC • Elevator Speech
process produces the defective item, how much improvement we
will make, when it will be done, etc. This information is
summarized in the project charter. Portions of deliverables 3D and
4D will also be on the charter.
3D Quantify Project Determine the benefit to the customer and to JEA for improving the • Project
Value process. Internal customer benefits are typically hard or soft $ Benefit
savings, productivity improvements, and employee satisfaction. Document
External customer benefits are typically customer retention,
customer satisfaction, and price and/or share increase. Deliverable
3D documents these benefits.
4D Develop Project To effectively manage a project, the GB/BB needs to identify team • ARMI • Faces of
Management members, effectively interface with the project stakeholders, plus • Project resistance
Plan develop and manage to a project plan (milestones and timelines). plan • Stakeholder
This plan should be developed and shared with all stakeholders. • Fist of five analysis
• Influence
strategy
• 3D’s
4. 2D - Define Project Boundaries
Primary Secondary
# Deliverable Deliverable Concept & Tasks Tool(s) Tool(s)
2D Define Project Once we understand the defect that needs to be • Proje • Included /
Boundaries improved (project Y), define the project boundaries and ct Excluded
components of the project. This includes a well written chart • Elevator
problem statement, identifying what process produces er Speech
the defective item, how much improvement we will • SIPO
make, when it will be done, etc. This information is C
summarized in the project charter. Portions of
deliverables 3D and 4D will also be on the charter.
Steps to Complete Deliverable:
1. Use the VOC, VOB, and CTQ information from deliverable 1D, complete the Project Charter CTQ
section.
2. Draft a Problem Statement containing the 4 key elements and enter this on the Project Charter.
3. Use the SIPOC, Included/Excluded, and Elevator Speech tools as needed to further refine the Project
Scope.
4. Complete the Goal Statement and Process Map Number sections of the project charter.
5. Enter the Process Capability, Project Stakeholders, Project Timeline and Estimated Benefits
information if available. If unknown at this point, enter and/or update these during deliverables
3D, 4D, and 9M.
6. Although deliverables 3D and 4D are listed as subsequent deliverables to 2D, the information from 3D
and 4D is reflected in the project charter of 2D. As such, all three deliverables are often pursued
simultaneously instead of sequentially.
5. Objectives –
Define Project Boundaries
Upon completing this module, students should be able to:
• Name the 4 elements of a problem statement
• Construct a problem statement from “real world” data
• Create a SIPOC
• Create an Included/Excluded worksheet
• Create an elevator speech
• Construct a goal statement from “real world” data
• Apply the green, yellow, and red color codes to the project
cycle time section of the project charter
• Fill in a blank charter using information from this and other
modules
6. Process Improvements
• Should “everything” be a DMAGIC project? NO!!
• Existing Processes
o Some solutions are so obvious they are “go-do’s”
o DMAGIC is a methodology to improves existing process when a
solution isn’t obvious or when multiple solutions exist
o Mgmt. directive to use a specific solution for various reasons
• New Processes
o Processes that don’t exist are DFSS (DMADV) candidates
o When a process can not be further improved because it has
reached it’s underlying mechanical limitations
(entitlement), capital project improvements are often required
(also DMADV)
7. A Good DMAIC Project:
• Improves an existing process
o Identify a process Q or P in your area that needs improvement
Management is responsible for making processes run
better, faster, etc. TargetSmart should not be something “in addition
to” this responsibility. It is a methodology to do this work better.
• Has a single defect
o Avoid projects “to fix this, and this, and this,…”
• Does not have an “obvious” solution
• Can obtain data frequently
• Is important to the business (you/Champion/VP/etc.)
• Can be completed in 2-5 month’s
8. A Poor DMAGIC Project:
• Has multiple and/or unclear defects listed (GB/BB and team is
confused on what to fix and gets bogged down)
• Already has a solution (a “go-do” project)
o “My project is to implement/create a new _____”
Common
o “The lack of a ____ causes ____”
• Is a series of known tasks to be executed
o “My project is to research ____, perform a cost analysis and …”
• Is not important to the business (lack of urgency)
• Has slow/hard to get data (hard to show improvement quickly)
• Uses cost as the defect (vs. the true underlying defect)
• Is outside your area (low team motivation)
• Is scoped too large or small (too complex/waste of team’s time)
Common
9. Why Not Use Cost as a Defect?
• High cost is certainly a valid reason to identify processes
for improvement. However, excess cost (COPQ) is
usually a result of the process defect, not the defect
itself.
o e.g. Process “A” and “B” both cost $200k/yr to run. Which has the
higher Cost of Poor Quality? Which do you improve first?
(If $ on a cost sheet were the only concern, we would work both)
• Processes with no defects still cost money to operate
o Consider a process that has been improved to the point of >6
operation but has a cost of $195k/yr. 2 years later, inflation raises
this “perfect” process to above the desired $200k/yr cost.
Has the defect returned?
How do we improve the process?
10. Why Have a Project Charter?
• A Project Charter Describes…
o The Purpose and Plan for the project
o What is the defect
o The scope of the project
o The process to be improved
o The Improvement goal
o Estimated project benefits
o Key players and their roles
11. Why Have a Project Charter?
• A Project Charter Helps…
o Develop clarity on the project
o Provide Direction for the team
o Keep the team “on task”
o Avoid “mission creep”
o Provide an evergreen roadmap for the project
Where is the Project Charter template?
15 Deliv template.ppt
12. Project Charter
Customer CTQ(s): Describe customer CTQ
{Project Map Number: Number here Here}
Process
Name & No.
(customer need/defect and spec limit.)
Black Belt: Name here
Problem Statement: List the 4 elements of a Process Owner: Name here
problem statement: Champion: Name here
* Defect identification Implementation Coordinator: Name here
* Magnitude of the defect (events/unit time, etc) Data Coordinator: Name here
* Where is the defect (location/group/segment) Team Members:
* Why this project is important to work now Name & function here
($, strategy support, etc) Name & function here
Name & function here
Project Scope: Name & function here
List project/process boundaries here Name & function here
Goal Statement: Increase(/decrease) the {primary Project Timeline:
metric} from {baseline state} to {improved state} by Assigned Define Measure Analyze Green Improve Control
{date} without negatively impacting {secondary
Sched Date Date Date Date Date Date Date
metric}.
Actual Date Date Date Date Date Date Date
Baseline Metric Performance (Time frame here):
Short Term Long Term
Zbench x.x x.x
Expected Benefits:
Hard Savings –$ xxx K
15 Deliv
DPMO xxxxxx xxxxxx Soft Savings –$ xxx K
Other Benefits:
template.ppt
List benefit here
List benefit here
13. Deliverable 2: Define
Improve Computer Delivery Time Proj. No. 12345
Customer CTQ(s): Configured computer Process Map Number: 1234
delivered to new employee within 10 working days
Black Belt: I. Cantwait
Process Owner: Weneedta Getbetter
Problem Statement: From 7/1/07 through
Champion: Ima Gonnahelp
6/30/08, new JEA employees located in downtown
Implementation Coordinator: Iwill Putinplace
Jacksonville received their configured
Data Coordinator: Ilove Numbers
laptop/desktop computer at an average of 11.0 days
Team Members:
(standard deviation = 2.04) vs. a 10 day USL. This
John – Installer
translates to an estimated productivity loss of
Paul – Installer
$225K/yr.
Project Scope: George – Supervisor
Includes new hires and transferred employees to Ringo - Purchasing
the downtown tower and CCC. Excludes all other
locations or electronic
Project Timeline:
Goal Statement: Decrease the average computer Assigned Define Measure Analyze Green Improve Control
delivery time from 11.0 days to 9.0 days by 11/20/08 Sched 7/1/08 7/15/08 8/30/08 9/30/08 10/7/08 10/20/08 11/20/08
without negatively impacting new computer inventory
Actual 7/1/08 7/12/08 9/5/08 9/28/08
or expediting costs.
Baseline Metric Performance (7/07-6/08): Example charter
Expected Benefits:
Short Term Long Term
Hard Savings – $15 K for project in
Zbench -0.72 -0.50
Soft Savings – $225 K Green phase
DPMO 763,253 692,088
Other Benefits:
Internal Customer Satisfaction Scores
16. Project Charter
Customer CTQ(s): Describe customer CTQ
{Project Map Number: Number here Here}
Process
Name & No.
(customer need/defect and spec limit.)
Black Belt: Name here
Problem Statement: List the 4 elements of a Process Owner: Name here
problem statement: Champion: Name here
* Defect identification Implementation Coordinator: Name here
* Magnitude of the defect (events/unit time, etc) This is our
Data Coordinator: Name here
Team Members:
* Where is the defect (location/group/segment)
* Why this project is important to work now Name & function here focus
($, strategy support, etc) Name & function here
Name & function here
Project Scope: Name & function here
List project/process boundaries here Name & function here
Goal Statement: Increase(/decrease) the {primary Project Timeline:
metric} from {baseline state} to {improved state} by Assigned Define Measure Analyze Green Improve Control
{date} without negatively impacting {secondary
Sched Date Date Date Date Date Date Date
metric}.
Actual Date Date Date Date Date Date Date
Baseline Metric Performance (Time frame here):
Short Term Long Term Expected Benefits:
Zbench x.x x.x Hard Savings –$ xxx K
DPMO xxxxxx xxxxxx Soft Savings –$ xxx K
Other Benefits:
List benefit here
List benefit here
17. What is a Problem Statement?
• The Problem Statement is a crisp description of the
customer/business problem or opportunity available
o Will be directly linked to the VOC, but may or may not use the same
units of measure as the VOC
e.g. A project to reduce customer hold time may measure the defect as
wait time (continuous) or proportion waiting over 4 min. (discrete)
• The Problem Statement does NOT contain:
o Proposed solutions or a statement of the suspected key X(s)
o A description of the project goal performance level
The project performance goal is described in the goal statement. The
project goal may or may not be identical to the customer specifications.
18. Problem Statement Elements
• There are 4 parts to a well written problem statement:
o Defect identification
Incorrect billing quantity, excessive cycle time, etc.
o Magnitude of the defect
Proportion defective, Avg. cycle time vs. goal, etc.
o Where is the defect
Location, affected group, market segment, etc
o Why this project is important to work now
Financial gain, strategy support, etc.
19. Building A Problem Statement
• Defect identification (describe the defect to be improved)
o e.g. 1: Excessive customer wait time
o e.g. 2: Low pH probe life
• Magnitude of the defect (events/unit time, etc)
o e.g. 1: 12% of Customers wait time exceeds 4 minutes
o e.g. 2: pH probes currently last an average 25 days vs. the
desired 60 days before failure
20. Building A Problem Statement
• Where is the defect (location/group/segment)
o e.g. 1: 12% of Customers calling (800-xxx,xxxx) have a wait time
exceeding 4 minutes
o e.g. 2: pH probes placed in effluent water service at NGS
currently last an average 25 days before failure
• Why this project is important to work now ($, strategy
support, etc)
o e.g. 1: 12% of Customers calling (800-xxx,xxxx) have a wait time
exceeding 4 minutes. This project needs to be pursued at this
time in order to support current strategy goals.
o e.g. 2: pH probes placed in effluent water service at NGS
currently last an average 25 days before failure. This represents a
COPQ of $200k/yr.
21. Example Problem Statements
• The 0.34ppm Chlorine standard • The variability of the water
deviation of the water arriving leaving Ridenour is high.
at the customer’s house is Customers complain of
excessive. COPQ from this Chlorine smell at times, and
defect is $25k/yr plus poor Sulfur smell at times. We need
customer satisfaction related to to improve this by increasing
occasional high Cl2 odor/taste. the degassing time.
• What makes this a good • What makes this a poor
example? example?
22. Problem Statement Exercise
• Form into teams of 3-4.
• Select one of the team member’s project and create a
Problem Statement for that process
• Alternative: Rewrite the following into a proper Problem
Statement
o No matter how many times employees have been reminded, they
don’t seem to remember to wear their safety glasses while at
Buckman. Records from March and April show that employees
wore their safety glasses only 70% of the time that they
should, and there doesn’t seem to be any effort to improve.
10
Min
24. Project Charter
Customer CTQ(s): Describe customer CTQ
{Project Map Number: Number here Here}
Process
Name & No.
(customer need/defect and spec limit.)
Black Belt: Name here
Problem Statement: List the 4 elements of a Process Owner: Name here
problem statement: Champion: Name here
* Defect identification Implementation Coordinator: Name here
* Magnitude of the defect (events/unit time, etc) Data Coordinator: Name here
* Where is the defect (location/group/segment) Team Members:
* Why this project is important to work now Name & function here
($, strategy support, etc) Name & function here
Name & function here
This is our
Project Scope:
List project/process boundaries here
Name & function here
focus
Goal Statement: Increase(/decrease) the {primary Project Timeline:
metric} from {baseline state} to {improved state} by Assigned Define Measure Analyze Green Improve Control
{date} without negatively impacting {secondary
Sched Date Date Date Date Date Date Date
metric}.
Actual Date Date Date Date Date Date Date
Baseline Metric Performance (Time frame here):
Short Term Long Term Expected Benefits:
Zbench x.x x.x Hard Savings –$ xxx K
DPMO xxxxxx xxxxxx Soft Savings –$ xxx K
Other Benefits:
List benefit here
List benefit here
25. What is Project Scope?
• The Project Scope statement describes the boundaries
of the process the project will improve
o Provides a common understanding among the stakeholders of
what is and is not included in the project
• Project Scope will describe items such as:
o Which locations are involved
e.g. Includes NGS, excludes SJRPP
o Which groups are involved
e.g. Includes new service customers, excludes all others
o Which process steps are involved
e.g. Includes the process steps associated with routine
billing, excludes establishing new service and discontinuing existing
service
26. Why is Project Scope Important?
• Projects with appropriate scope move quickly
• Projects with large scope (“Boil the Ocean”)
rarely proceed smoothly
• As project scope increases:
o “Success” often requires fixing more than one defect
o “Success” requires a different solution to the same defect at
different locations – multiple improvement strategies, multiple
control plans, multiple training programs, etc.
o Project Cycle time increases!!!
o Six Sigma, the Belt leading the project, and the
team as a whole are viewed as slow and ineffective
27. When Do You Manage Scope?
• Project Assignment
o When a project is first assigned, clearly defining the defect and
project scope are vital! Most other define phase work (team
selection, COPQ, project timeline, etc.) are determined by these.
• Early Define Phase Meetings
o Early team meetings are often filled with energy to fix more than
one defect “while we are at it”. Be wary of “scope creep”!
• Mid-project changes
o Mid-project scope reductions are sometimes difficult to
accomplish. Process Owners and Champions are expecting
success on the original scope. They can leave stakeholders
feeling “the job wasn’t done right”.
28. Determining Project Scope
• Defining the project scope begins in Deliverable 1 with
project Y data stratification & segmentation. It is
appropriate to refine it in Deliverable 2.
o e.g. Is the project about reducing the proportion of customers who
do not pay their bills within 30 days, or reducing the proportion the
customers whose payments are late enough to reach service
termination (a subset of customers who do not pay within 30
days)??
• Use the following tools to refine project scope
o SIPOC
o Included/Excluded
o Elevator speech
31. Processes
• All activity takes place in terms of a process
o The quality of the process determines the quality of the output
• Shocking lessons
o #1: Most people do not think in terms of processes.
They would rather think in terms of isolated events.
o #2: When convinced of the
value of thinking in terms
of processes, most
people still don’t think
in terms of processes.
o #3: The word “process”
generates fear and resistance.
32. Why Create a SIPOC Map?
• To develop a high-level view of the process
• To avoid scope creep
• To highlight areas for improvement
• To ensure customer focus
33. SIPOC Definitions
• Supplier: Internal or External - whoever provides the
input to your process
• Input: The item (tangible entity or data) that a process
uses to produce an output
• Process: A repetitive and systematic series of actions or
operations whereby an input is used to achieve an
outcome, product, or defined goal
• Output: The material or data that results from the
operation or a process
• Customer: Internal or External - whoever receives the
output of your process
34. SIPOC: Inputs
Labor
Material
Ideas Process
Information
Environment
35. SIPOC: High-Level Process View
Process
• A high-level view is often captured as a top-level flowchart
Step 1: Step 2: Step 3: Step 4:
Bottling Labeling Inspecting Packaging
36. SIPOC: Outputs
Physical products
Documents
Process Information
Services
Decisions
37. SIPOC Components
• Suppliers/Inputs • Outputs
o Where does the information or o What product does this
material you work on come process make?
from? Who are your suppliers? o What are the outputs of this
o What do they supply? process?
o Where do they affect the o At what point does this process
process flow? end?
o What effect do they have on • Customers
the process and on the o Who uses the products from
outcome? this process?
• Process steps o Who are the customers of this
o What happens to each input? process?
o What conversion activities take
place?
38. How to Create a SIPOC
1. Name the process
2. Brainstorm and identify the process steps
3. Identify, name and order the major process steps
4. Clarify the start and the stop (boundaries) of the process
5. List key inputs and suppliers
6. List key outputs and customers
Remember – the purpose of a SIPOC is to define
project boundaries, not describe the process in detail. A
full process map will be developed in Measure.
39. SIPOC Example
Suppliers Inputs Process Outputs Customers
Manufacturer Copier Copies You
Office Supply
Company Paper Making a File
photocopy
Toner Others
Yourself Original
Power Company Electricity
Process Steps Boundary Boundary
Put Close Lid Adjust Press Remove
original Settings START originals
on glass and copies
15 Deliv template.ppt
40. SIPOC Exercise
• Form into teams of 3-4.
• Select one of the team member’s project and create a
SIPOC for that process
Tip – Sticky notes work very well when creating a
SIPOC. It allows the team to brainstorm and
rearrange items with minimal effort.
20
Min
42. “Included/Excluded” Description
• The Included/Excluded worksheet is a tool to facilitate
discussion of the project boundaries
• Can be used in conjunction with a SIPOC
• Instructions to complete the “Included/Excluded”
worksheet:
o Complete the worksheet in a team meeting
Main value comes from team discussion & consensus
o Answer the What, Where, When, Who questions in sequence
o “Other” is for any miscellaneous entries
43. Included/Excluded
INCLUDED EXCLUDED
• What __________________ • _____________________
• Where _________________ • _____________________
• When __________________ • _____________________
• Who ___________________ • _____________________
• Other __________________ • _____________________
15 Deliv template.ppt
44. Example - Included/Excluded
INCLUDED EXCLUDED
• What __________________
Grease related SSO’s • _____________________
All other SSO’s
• Where _________________ • _____________________
Southside All other areas
• When __________________ • _____________________
• Who ___________________
All time periods included • _____________________
No time periods excluded
• Other __________________ • _____________________
Commercial and
Restaurant locations Residential locations
n/a n/a
45. Included/Excluded Exercise
• Form into teams of 3-4.
• Select one of the team member’s project and create an
Included/Excluded worksheet for that project
15
Min
47. What is an Elevator Speech?
• An Elevator Speech is a concise verbal description of
what the project is about.
• Imagine getting on an elevator with an EMT member
and they ask about your most recent project. You have
only a few seconds to describe your project, so you
must be brief and to the point. What would you say?
• Example Elevator Speech:
o “My team and I have a project to reduce the number of demurrage
days incurred to offload solid boiler feed products at NGS. Over
the past year, JEA experienced 20 demurrage days. Our goal is to
reduce this to two days per year or less by 12/1/08 for a savings
of ~$45k/yr.”
48. Elevator Speech Exercise
• Form into teams of 3-4
• Create an Elevator Speech for each member’s project
20
Min
50. Project Charter
Customer CTQ(s): Describe customer CTQ
{Project Map Number: Number here Here}
Process
Name & No.
(customer need/defect and spec limit.)
Black Belt: Name here
Problem Statement: List the 4 elements of a Process Owner: Name here
problem statement: Champion: Name here
* Defect identification Implementation Coordinator: Name here
* Magnitude of the defect (events/unit time, etc) Data Coordinator: Name here
* Where is the defect (location/group/segment) Team Members:
* Why this project is important to work now ($, Name & function here
strategy support, etc) Name & function here
Name & function here
This is our
Project Scope:
List project/process boundaries here
Name & function here
focus
Goal Statement: Increase(/decrease) the {primary Project Timeline:
metric} from {baseline state} to {improved state} by Assigned Define Measure Analyze Green Improve Control
{date} without negatively impacting {secondary
Sched Date Date Date Date Date Date Date
metric}.
Actual Date Date Date Date Date Date Date
Baseline Metric Performance (Time frame here):
Short Term Long Term Expected Benefits:
Zbench x.x x.x Hard Savings –$ xxx K
DPMO xxxxxx xxxxxx Soft Savings –$ xxx K
Other Benefits:
List benefit here
List benefit here
51. What is a Goal Statement?
• The Goal Statement defines the project’s improvement
objectives – “what will be improved and by when”
• The goal should be “S.M.A.R.T.”
o S = Specific
o M = Measurable performance
o A = Attainable
o R = Relevant to the project
o T = Time bound
• After defining Primary and Secondary Metrics, you will
learn how to use the standard goal statement
52. Primary and Secondary Metrics
• The “Primary Metric” is the metric being improved by the
project. It will have the same units of measure as those
expressed in the problem statement
o Number of Document transactions/hr
o Pump Repair Cycle Time
• The “Secondary Metric” is the metric that must not be
negatively impacted while improving the primary metric
o Proportion of Documents with information defects
o Pump Critical Dimensions within specs
• If your project has an efficiency related primary metric
(typically VOB), the secondary is often effectiveness
(typically VOC) - and vice versa
53. Primary and Secondary
Metric Examples
• Example 1: For a project with a primary metric of
reducing the proportion of incorrect customer bills, the
secondary metric may be to not increase bill processing
time
o Primary metric = effectiveness, secondary = efficiency
• Example 2: For a project with a primary metric of
increasing the life of a NGS pH probe, the secondary
metric may be pH probe accuracy
o Primary metric = efficiency, secondary = effectiveness
54. Standard Goal Statement
• When the primary and secondary goal statements have
been established, use them to complete the following
sentence:
• Increase/Decrease the {Primary Metric} from {Baseline
State} to {Improved State} by {Date} without negatively
impacting {Secondary Metric}.
• Is this a S.M.A.R.T goal statement?
55. Example Goal Statements
• Good examples:
o Decrease the proportion of telephone customers who are on hold
more than 4 min. from 12% to 6% by 12/13/08 without increasing
headcount.
o Increase the average pH probe life at NGS from 25 days to 60
days by 2/1/09 without negatively impacting the number of manual
calibrations required.
• Poor examples:
o Increase pump life by 60% by 2/1/09.
o Decrease the number of employee hours required to process a
document by instituting a new document sorting system.
56. Goal Statement Exercise
• Form into teams of 3-4
• Create a properly phrased Goal Statement for each
member’s project
20
Min
57. Remaining Project Charter Items
Baseline Metric Performance
Process Map Number
Project Stakeholders
Project Timeline
Expected Benefits
58. Project Charter
Customer CTQ(s): Describe customer CTQ
{Project Map Number: Number here Here}
Process
Name & No.
(customer need/defect and spec limit.)
Black Belt: Name here
Problem Statement: List the 4 elements of a Process Owner: Name here
problem statement: Champion: Name here
* Defect identification Implementation Coordinator: Name here
* Magnitude of the defect (events/unit time, etc) Data Coordinator: Name here
These are
* Where is the defect (location/group/segment) Team Members:
* Why this project is important to work now Name & function here
our focus
($, strategy support, etc) Name & function here
Name & function here
Project Scope: Name & function here
List project/process boundaries here Name & function here
Goal Statement: Increase(/decrease) the {primary Project Timeline:
metric} from {baseline state} to {improved state} by Assigned Define Measure Analyze Green Improve Control
{date} without negatively impacting {secondary
Sched Date Date Date Date Date Date Date
metric}.
Actual Date Date Date Date Date Date Date
Baseline Metric Performance (Time frame here):
Short Term Long Term Expected Benefits:
Zbench x.x x.x Hard Savings –$ xxx K
DPMO xxxxxx xxxxxx Soft Savings –$ xxx K
Other Benefits:
List benefit here
List benefit here
59. Baseline Metric Performance
• “Baseline” data is data for the project Y (and X’s if
available) over the recent past
• For a project to be completed in an acceptable cycle
time, it needs to have (at least some) “baseline” data
• How much data should you have?
o Ideally 12 months
o If less than 12 months data is not available, use what is available
Key issue is to have some long term data. The length of time this
represents is unique to each project.
o If there is no baseline data available, consider postponing the
project launch until some baseline data has been gathered
60. Baseline Metric Performance
• What do “Zbench”, “DPMO”, “Short Term”, and “Long
Term” mean?
o These are process capability terms which relate process
performance to customer specifications. These will be calculated
in deliverable 9M.
o Enter these values if known or obtain assistance to calculate them
61. Process Map Number
• JEA has an extensive set of process maps with P and Q
metrics
o Q’s are output parameters = project Y’s
o P’s are input parameters = project X’s
• The Y for your project should be the Q on the process
owners process map
• Document the process map number on the project
charter
62. Project Stakeholders
• A Stakeholder is anyone “touched” by the project. In
addition to the team members, this includes customers
and suppliers (internal and/or external).
• List the Project Stakeholders who will be actively
supporting the project on the Project Charter. When a
project is first launched, some of the Stakeholders may
not yet be identified.
63. Project Timeline
• Enter the project timeline by phase when known.
• The target timeline is 120 days for a complete DMAGIC
project. Use this overall cycle time unless it is
determined the timeline should be different.
• As each phase is completed, use a green, yellow, red
color code to highlight cycle time performance vs. the
schedule
o Green = Actual cycle time to date is equal to or ahead of schedule
o Yellow = Actual cycle time to date is 7 days or less over schedule
o Red = Actual cycle time to date is more than 7 days over
schedule
64. Expected Benefits
• “Expected Benefits” are a summary of the benefits which
the project will bring
o “Hard” financial savings
o “Soft” financial savings
o Non-financial benefits (e.g. customer satisfaction)
• Expected Benefits calculations will be covered in detail
in Deliverable 3D
66. Deliverable 2: Define
Improve Computer Delivery Time Proj. No. 12345
Customer CTQ(s): Configured computer Process Map Number: 1234
delivered to new employee within 10 working days
Black Belt: I. Cantwait
Process Owner: Weneedta Getbetter
Problem Statement: From 7/1/08 through
Champion: Ima Gonnahelp
6/30/08, new JEA employees located in downtown
Implementation Coordinator: Iwill Putinplace
Jacksonville received their configured
Data Coordinator: Ilove Numbers
laptop/desktop computer at an average of 11.0 days
Team Members:
(standard deviation = 2.04) vs. a 10 day USL. This
John – Installer
translates to an estimated productivity loss of
Paul – Installer
$225K/yr.
Project Scope: George – Supervisor
Includes new hires and transferred employees to Ringo - Purchasing
the downtown tower and CCC. Excludes all other
locations or electronic
Project Timeline:
Goal Statement: Decrease the average computer Assigned Define Measure Analyze Green Improve Control
delivery time from 11.0 days to 9.0 days by 11/20/08 Sched 7/1/08 7/15/08 8/30/08 9/30/08 10/7/08 10/20/08 11/20/08
without negatively impacting new computer inventory
Actual 7/1/08 7/12/08 9/5/08 9/28/08
or expediting costs.
Baseline Metric Performance (7/08-6/08): Example charter for
Expected Benefits:
Short Term Long Term
Hard Savings – $15 K project in Green
Zbench -0.72 -0.50
Soft Savings – $225 K phase
DPMO 763,253 692,088
Other Benefits:
Internal Customer Satisfaction Scores
68. Project Charter Exercise 1
• Complete a Project Charter for the following scenario
o “Hi Sue, I have been meaning to talk to you. I was doing some
data analysis last week and found that the Cl2 level in water
arriving at the customer’s house has averaged 1.35ppm over the
past 6 month’s. The FDEP stipulates the minimum Cl2 content is
0.20ppm which is a long way from 1.35. I know that we have to
take into account that some days have a higher Cl2 level than
others so I calculated the standard deviation to be 0.31. If we can
shift the mean closer to the lower spec, we stand to save $25k for
every 0.10ppm of reduction. Would you be willing to take on a
project to get the average down to 1.0ppm?”
15
Min
70. Example 1 - Solution
Customer CTQ(s): Cl2 content in water leaving Process Map Number: Number here
Ridenour averages 1.0ppm.
Black Belt: Name here
Problem Statement: The Cl2 content of Process Owner: Name here
Ridenour’s water averages 1.35ppm vs. a goal of Champion: Name here
1.0ppm. This equates to a $100k opportunity for Implementation Coordinator: Name here
Cl2 savings. Data Coordinator: Name here
Team Members:
Name & function here
Project Scope: Name & function here
Includes the water leaving Ridenour and Name & function here
excludes all other locations or water Name & function here
contaminants. Name & function here
Goal Statement: Decrease the Cl2 content at Project Timeline:
Ridenour from 1.35ppm to 1.0ppm by 2/1/09 without
negatively impacting our ability to meet FDEP limits. Assigned Define Measure Analyze Green Improve Control
Sched 7/1/08 7/15/08 8/30/08 9/30/08 10/7/08 10/20/08 11/20/08
Actual
Baseline Metric Performance (2/08 – 7/08):
Short Term Long Term Expected Benefits:
Zbench 22.9 3.71 Hard Savings – 100 $K
DPMO 0 103 Soft Savings – xxx $K
Other Benefits:
List benefit here
List benefit here
71. Project Charter Example 2
• Complete a Project Charter for the following scenario
o “I have been looking at my budget and don’t like what I see. Our
cost to maintain the lime pumps is outrageous and I would like to
shave 20% off the $13,500/mo. we spend. I put the last 10
month’s of data into the file Lime pump cost.mtw for you to use.
Joe and Ruth are two mechanics that are pretty familiar with the
area so let’s use them as team members.”
10
Min
72. Example 2 - Solution
A charter should not be completed for the Lime Pump Cost
charter as presented. There is no specific process defect
outlined. Stating cost as a defect does not reflect a process
oriented problem solving methodology. Cost is a result of
the defect – not the defect itself.
It is certainly valid to start researching a project based on
the opinion that costs are too high, but there needs to be a
drilldown to understand what defect needs to be improved.
For example, a $500k/yr cost could represent a large,
small, or NO underlying defect within the current process.
Remember, COPQ is the Cost of Poor Quality. It’s not Cost
Is Poor Quality.
73. Project Charter Example 3
• Complete a Project Charter for the following scenario
o “I have been looking at my budget and don’t like what I see. The
cost to maintain NGS lime pumps is outrageous and I would like
to shave 20% off the $13,500/mo we spend. The cost is mostly
related to the mechanical pump seals. They just don’t seem to last
like they should, with an average life of around 37 days with some
lasting only ~20 days. I put the last 10 month’s of seal life data
into the file Lime pump seal life.mtw for you to use. If we can get
them to the point where minimum life is 35 days I would consider
that a victory. Joe and Ruth are two mechanics that are pretty
familiar with the area so let’s use them as team members and
start on Sept 1.”
10
Min
75. Example 3 - Solution
Customer CTQ(s): Lime pump seal life meets Process Map Number: Number here
or exceeds 35 days.
Black Belt: Name here
Problem Statement: The Lime pump seal life at Process Owner: Name here
NGS currently averages 37 days vs. a desired Champion: Name here
minimum of 35 for any individual seal. This Implementation Coordinator: Name here
equates to $xxx/yr COPQ. Data Coordinator: Name here
Team Members:
Name & function here
Project Scope: Name & function here
Includes Lime pump seals at NGS, excludes Name & function here
all other locations or pumps Name & function here
Goal Statement: Increase the NGS lime pump seal Project Timeline:
life from an average 37 days to 58 days by 2/1/09 Assigned Define Measure Analyze Green Improve Control
without negatively impacting maintenance costs.
Sched 9/1/08 10/5/08 11/1/08 12/1/08 1/1/09 2/1/09 3/1/09
Actual
Baseline Metric Performance (12/07 – 8/08):
Short Term Long Term Expected Benefits:
Zbench 0.35 0.27 Hard Savings – xxx $K
DPMO 362163 392180 Soft Savings – xxx $K
Other Benefits:
List benefit here
List benefit here
76. Project Charter Exercise 4
• Complete a Project Charter for the following scenario
o “Hi George, I have been hoping to bump into you. I have a great
project I would like you to work on. My group has been looking at
the way we do our CAD drawings and are convinced it is
antiquated. MicroSquish has some new software in beta release
called “Be-a-CAD” that will probably increase productivity by
$100k/yr. We have tentatively agreed to be one of their beta test
sites in exchange for a 10% price break on the purchase price.
Since you have some experience in CAD systems, you are just
the person to help put together a well thought out transition plan
and have the new system in place 6 month’s from now”.
10
Min
77. Example 4 - Solution
A charter should not be completed for the Microsquish CAD
software proposal. This is not a DMAIC project. It may be a
very valid improvement to implement – it just isn’t a DMAIC
project.
When the business wants to implement a known solution, or
when the tasks to achieve an end goal are known and
obvious, this is a “just do it” project. Select an appropriate
task force leader and proceed.
DMAIC is used when the solution isn’t “obvious”. Rule of
thumb – if you ask 4-6 people who have a different
perspective of the problem what 1 thing they would do to fix
the problem, and you get the same answer, it is a “just do it”.
If you get several answers, use “DMAIC”.
78. Homework – 2D
• Complete a Project Charter for the following scenario
and be prepared to show your results tomorrow
o A Process Owner at Pearl St. tells you “I just haven’t done a good
job of getting my crew on the road in the morning. Ideally, the jobs
would be assigned to all 40 employees and the trucks would be
departed within 30 minutes of start time. I have been tracking this
over the past 10 weeks and we seem to average 35 minutes. At
$17.50/hour, that is a lot of money spent just sitting. Today is Aug
1 and I would like to get this fixed as soon as possible. How soon
can you start the project?”
o You can leave the map number and team member names blank.
o See following Process Capability graph for supporting information.
80. Pearl St. Example
{Project Map Number: Number here Here}
Customer CTQ(s): Each Pearl St. Crew heading Process
Name & No.
to a work location < 30 min of start time.
Black Belt: Name here
Problem Statement: Work crews at Pearl St. are Process Owner: Name here
taking an average 35 minutes to obtain work Champion: Name here
assignments and depart the yard vs. a 30 minute Implementation Coordinator: Name here
individual crew maximum. Reducing this to a 20 Data Coordinator: Name here
min avg. equates to $xxx/yr in lost productivity. Team Members:
Name & function here
Project Scope: Name & function here
Includes all Pearl St. work crews, excludes all Name & function here
other locations. Name & function here
Goal Statement: Decrease the work crew departure Project Timeline:
delay from an average of 35min to 20 min by 1/2/09 Assigned Define Measure Analyze Green Improve Control
without negatively impacting accuracy or
Sched 9/1/08 10/5/08 11/1/08 12/1/08 1/1/09 2/1/09 3/1/09
completeness of work assignments.
Actual
Baseline Metric Performance (5/08-7/08):
Short Term Long Term Expected Benefits:
Zbench -2.39 -0.85 Hard Savings – xxx $K
DPMO 991625 803225 Soft Savings – xxx $K
Other Benefits:
List benefit here
List benefit here
81. Learning Check –
Define Project Boundaries
Upon completing this module, students should be able to:
• Name the 4 elements of a problem statement
• Construct a problem statement from “real world” data
• Create a SIPOC
• Create an Included/Excluded worksheet
• Create an elevator speech
• Construct a goal statement from “real world” data
• Apply the green, yellow, and red color codes to the project
cycle time section of the project charter
• Construct a blank charter using information from this and
other modules